 About Us
Attack Paths is currently available for AWS providers. Support for
additional providers is planned.
Prerequisites
The following prerequisites are required for Attack Paths:- An AWS provider is configured with valid credentials in Prowler Cloud. For setup instructions, see Getting Started with AWS.
- At least one scan has completed on the configured AWS provider and produced graph data. Attack Paths scans run automatically alongside regular security scans, no separate configuration is required.
How Attack Paths Scans Work
Attack Paths scans are generated automatically when a security scan runs on an AWS provider. Each completed scan produces graph data that maps relationships between IAM principals, policies, trust configurations, and other resources. Once the scan finishes and graph data is ready, the scan appears in the Attack Paths scan table with a Completed status and a check in the Graph column. Scans that are still queued or running remain visible, but they cannot be selected until graph data is ready.Since Prowler scans all configured providers every 24 hours by default,
Attack Paths data stays up to date automatically.
Accessing Attack Paths
To open Attack Paths, click Attack Paths in the left navigation menu.
- Select a scan with graph data.
- Choose a built-in query or a custom openCypher query.
- Add parameters when the selected query requires them.
- Execute the query and explore the resulting graph.
Selecting a Scan
The scans table displays all Attack Paths scans with the following columns:- Select: A radio button used to choose a scan. The radio button is disabled when graph data is not available.
- Provider: The AWS provider alias and account identifier.
- Last Scan Date: When the scan completed.
- Status: Current state of the scan, such as Completed, Executing, Scheduled, or Failed.
- Graph: Whether Attack Paths graph data is available for the scan.
- Duration: Total scan time.
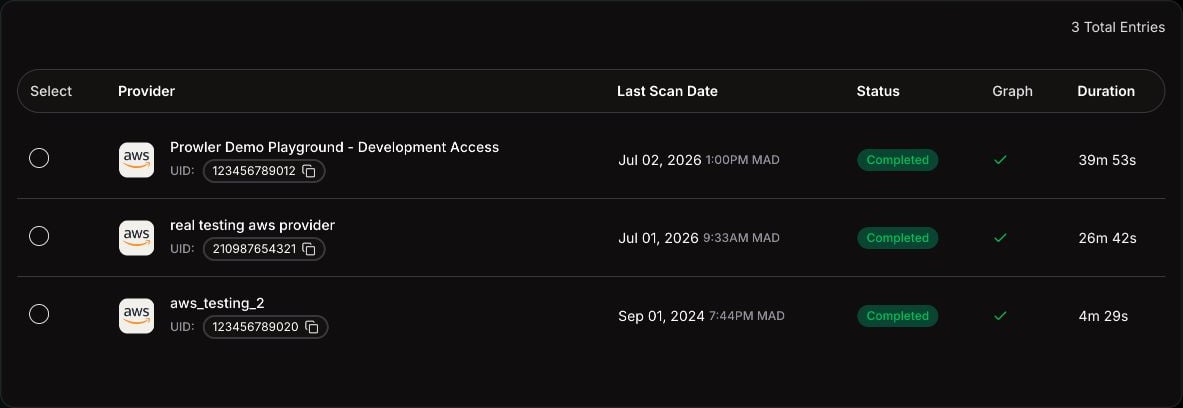
Only scans with graph data can be selected. Disabled rows include a tooltip
that explains why the graph is not available yet.
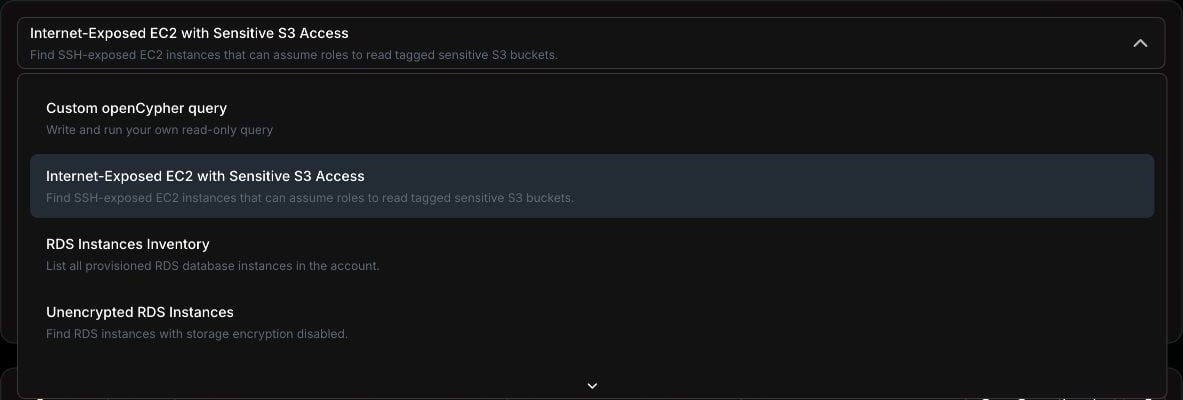
Choosing a Query
After selecting a scan, the query selector becomes available. Each query targets a specific privilege escalation, exposure, inventory, or misconfiguration pattern. To choose a query, click the dropdown and select from the available options. Each option displays:- Query name: A descriptive title, such as Internet-Exposed EC2 with Sensitive S3 Access.
- Short description: A brief summary of what the query detects.
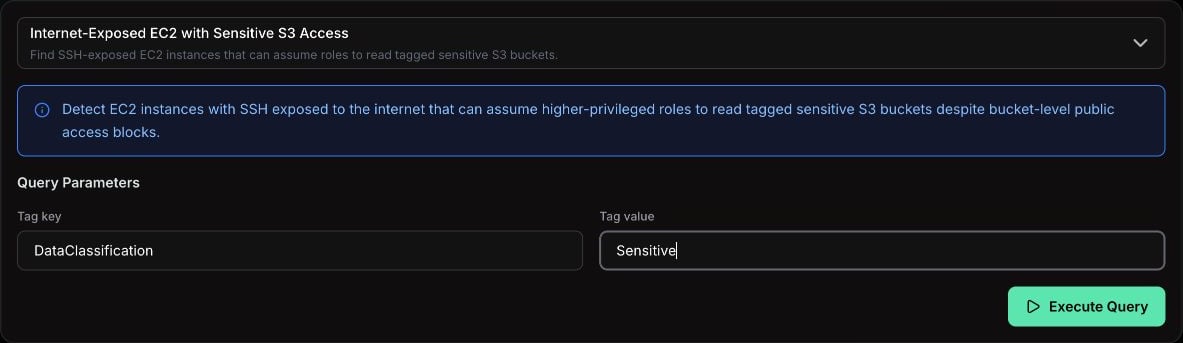
Configuring Query Parameters
Some queries accept optional or required parameters to narrow the scope of the analysis. When a query has parameters, a form appears below the query description.- Required fields are marked with an asterisk (*) and must be filled before executing.
- Optional fields refine the query results but are not mandatory.
- Queries without parameters show no parameter form.
Writing Custom openCypher Queries
In addition to the built-in queries, Attack Paths supports custom read-only openCypher queries. Custom queries provide direct access to the underlying graph so security teams can answer ad-hoc questions, prototype detections, or extend coverage beyond the built-in catalogue. To write a custom query, select Custom openCypher query from the query dropdown. A code editor with syntax highlighting and line numbers appears, ready to receive the query.Constraints and Safety Limits
Custom queries are sandboxed to keep the graph database safe and responsive:- Read-only: Only read operations are allowed. Statements that mutate the graph (
CREATE,MERGE,SET,DELETE,REMOVE,DROP,LOAD CSV,CALL { ... }writes, etc.) are rejected before execution. - Length limit: Each query is capped at 10,000 characters.
- Scoped to the selected scan: Results are automatically scoped to the provider and scan selected in the scan table. There is no need to filter by tenant or scan identifier in the query body.
Example Queries
The following examples are read-only and can be pasted directly into the editor. Each one demonstrates a different graph traversal pattern. Internet-exposed EC2 instances with their security group rules:Working with List-Typed Properties
Some Cartography node properties carry a list of values, such asaction, resource, notaction, and notresource on AWSPolicyStatement nodes, the algorithms on KMSKey, the container-definition lists on ECSContainerDefinition, and many others. The Attack Paths graph models each such property as a set of child item nodes connected to the parent by a typed edge. To read the values, traverse the edge; the parent does not carry the list as a single field.
The naming convention for any list-typed property on a parent label is:
- Child label:
<ParentLabel><PropertyPascal>Item. Example:AWSPolicyStatement.resourceresolves toAWSPolicyStatementResourceItem. - Edge type:
HAS_<PROPERTY_UPPER>. Example:resourceresolves toHAS_RESOURCE. - Child property:
valuefor scalar lists (one string per list element). List-of-dict properties (rare; for exampleSecretsManagerSecretVersion.tags) carry the original dict keys as named fields on the child node.
HAS_* edge in its own MATCH clause and apply the predicate in the attached WHERE. RETURN DISTINCT collapses duplicate parent rows produced when multiple child items satisfy the filter:
HAS_* traversal as its own MATCH and check the substring relationship between the item value and the dynamic node in WHERE:
Working with JSON-Encoded Properties
Some Cartography properties represent nested objects, most notablycondition on AWSPolicyStatement and S3PolicyStatement nodes. In the Attack Paths graph, object-typed properties are stored as JSON-encoded strings to keep the schema portable across graph backends. The value looks like:
CONTAINS for substring checks against keys or known values:
Tips for Writing Queries
- Start small with
LIMITto inspect the shape of the data before broadening the pattern. - Traverse
HAS_*edges to reach list-typed property values (for exampleaction,resource). The parent node does not carry the list as a single field; see Working with List-Typed Properties for the patterns. - On large scans, avoid broad disconnected patterns such as
MATCH (a:Label), (b:OtherLabel). Bind one side with a selective predicate first, and useWITH DISTINCTbetween expanding traversals when duplicates are possible. - Use
RETURNprojections (RETURN n.name, n.region) instead of returning whole nodes to keep responses compact. - Combine resource nodes with
ProwlerFindingnodes viaHAS_FINDINGto correlate misconfigurations with the affected resources. - When a query times out or returns no rows, simplify the pattern step by step until the first variant runs successfully, then add constraints back.
Cartography Schema Reference
Attack Paths graphs are populated by Cartography, an open-source graph ingestion framework. The node labels, relationship types, and properties available in custom queries follow the upstream Cartography schema for the corresponding provider. For the complete catalogue of node labels and relationships available in custom queries, refer to the official Cartography schema documentation: In addition to the upstream schema, Prowler enriches the graph with:ProwlerFindingnodes representing Prowler check results, linked to affected resources viaHAS_FINDINGrelationships.Internetnodes used to model exposure paths from the public internet to internal resources.- List-typed properties such as
actionorresourceonAWSPolicyStatement, the algorithm lists onKMSKey, and similar lists on other node types are modeled as child item nodes linked by typedHAS_*edges. See Working with List-Typed Properties for the read pattern. - Object-typed properties such as
conditiononAWSPolicyStatementare stored as JSON-encoded strings. See Working with JSON-Encoded Properties for the read pattern.
AI assistants connected through Prowler MCP Server can fetch the exact
Cartography schema for the active scan via the
prowler_get_attack_paths_cartography_schema tool. This guarantees that
generated queries match the schema version pinned by the running Prowler
release.Executing a Query
To run the selected query against the scan data, click Execute Query. The button is disabled until a query is selected and all required parameters are valid. The button displays a loading state while the query runs. After the query completes, the graph appears below the query builder. If the query returns no results, an informational message appears. Common reasons include:- No matching patterns found: The scanned environment does not contain the pattern the query targets.
- Not enough permissions: The scan credentials may not have captured all the data the query needs.
- Server unavailable: The graph service may be temporarily unavailable.

Exploring the Graph
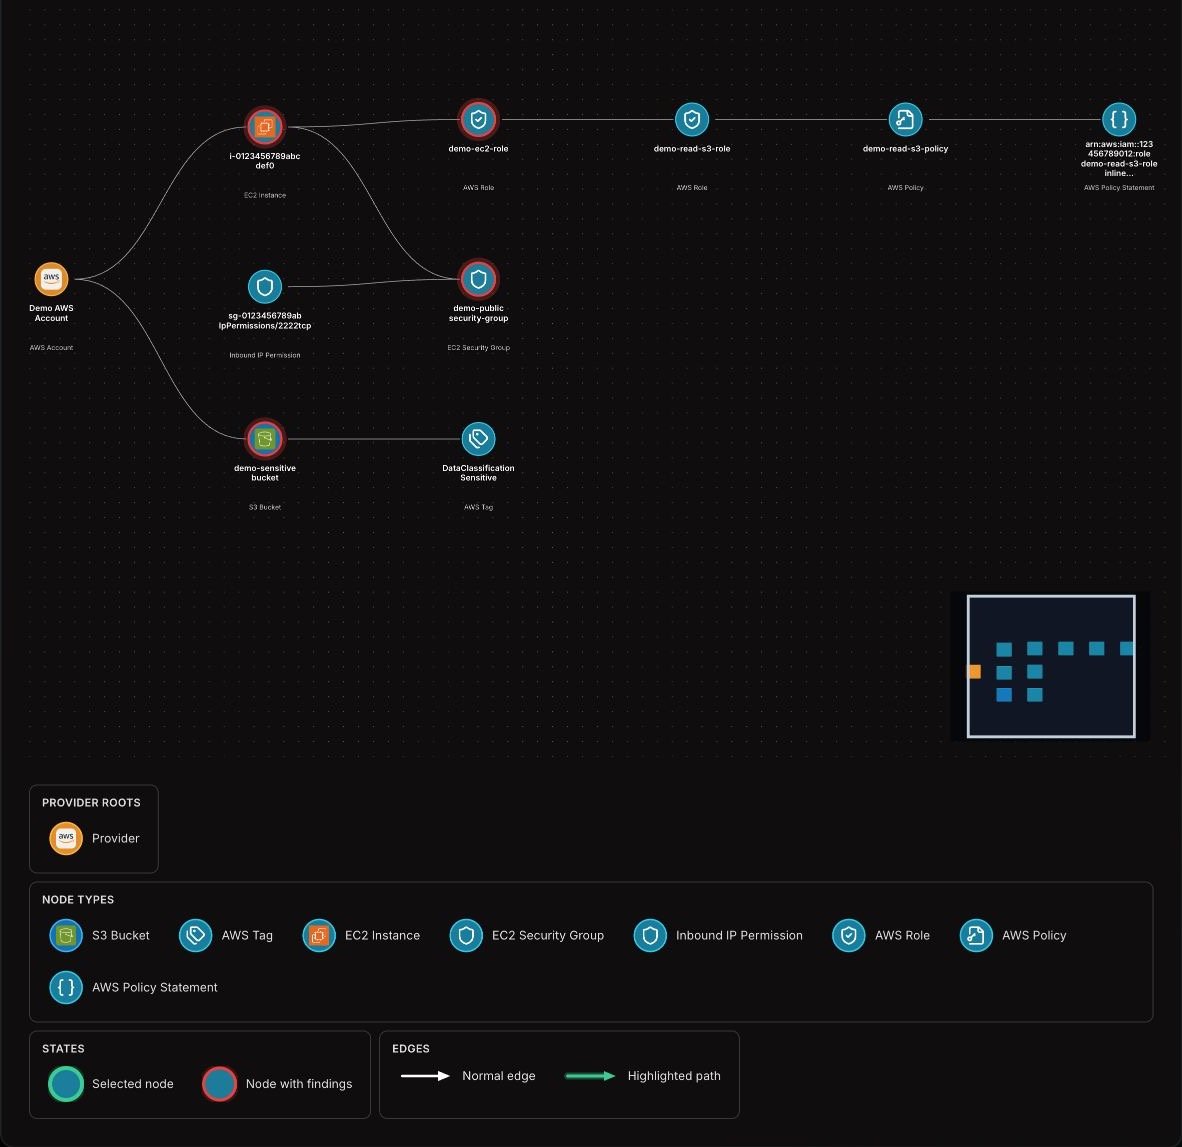
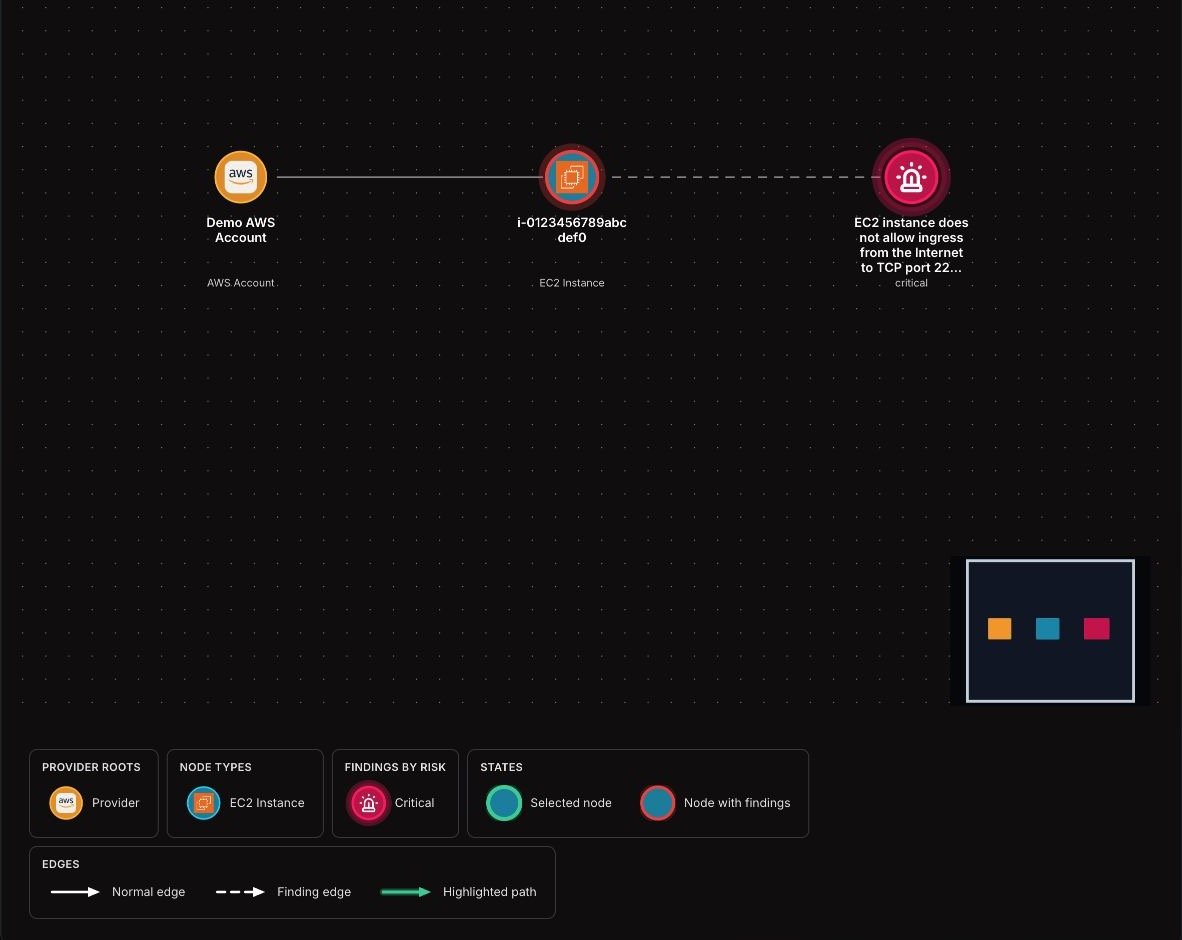
After a successful execution, the graph visualization renders below the query builder. The graph maps relationships between cloud resources, IAM entities, public exposure, and security findings.Node Types
- Provider root nodes: Represent the AWS account or provider root for the selected scan.
- Resource nodes: Represent cloud resources such as IAM roles, policies, EC2 instances, security groups, and S3 buckets.
- Internet nodes: Represent exposure from the public internet.
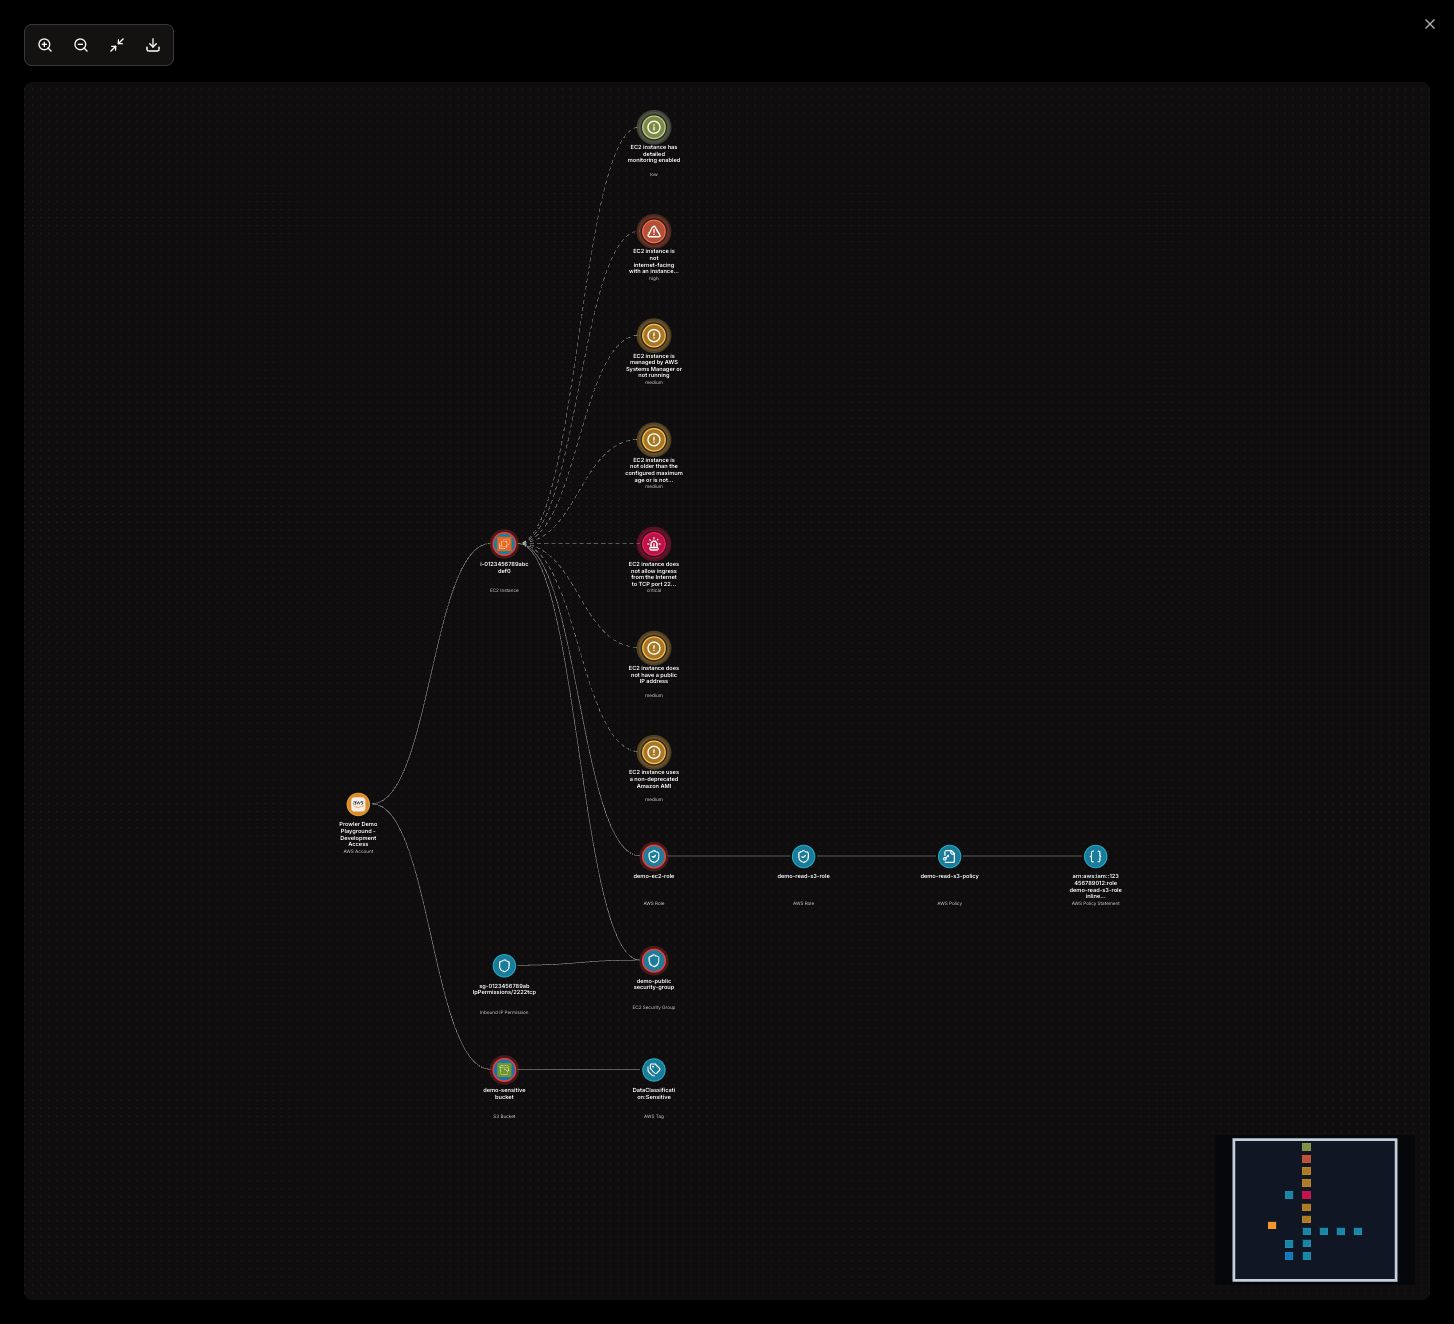
- Finding nodes: Represent Prowler findings linked to resources. Finding colors indicate risk level, such as critical, high, medium, or low.
Edge Types
- Normal edges: Direct relationships between graph nodes, such as role-to-policy or resource-to-security-group relationships.
- Finding edges: Dashed relationships between resources and their associated findings.
- Highlighted paths: Green edges that show the active path when you hover a node or focus a finding.
Interacting with the Graph
The graph banner describes the main interactions:- Click a finding to focus its connected path.
- Click a resource with findings to show or hide its related findings.
- Hover a node to highlight its connected path.
Showing Related Findings
Resource nodes with related findings are clickable. Click one of these resources to show its finding nodes. Click the resource again to hide them. The graph automatically fits the selected resource and its related findings when the findings are shown.Focusing a Finding Path
Click a finding node to focus the graph on the path connected to that finding. When the graph is focused:- The graph shows Back to Full View.
- The status banner shows the selected finding.
- The graph keeps only the connected path in view.
- The finding detail drawer opens.
Graph Controls
The toolbar in the top-right corner of the graph provides:- Zoom in / Zoom out: Adjust the zoom level
- Fit graph to view: Reset the view to fit the visible graph
- Export graph: Download the current graph as a PNG file
- Fullscreen: Open the graph in a full-size modal
Use Ctrl + Scroll (or Cmd + Scroll on macOS) to zoom directly within
the graph area.
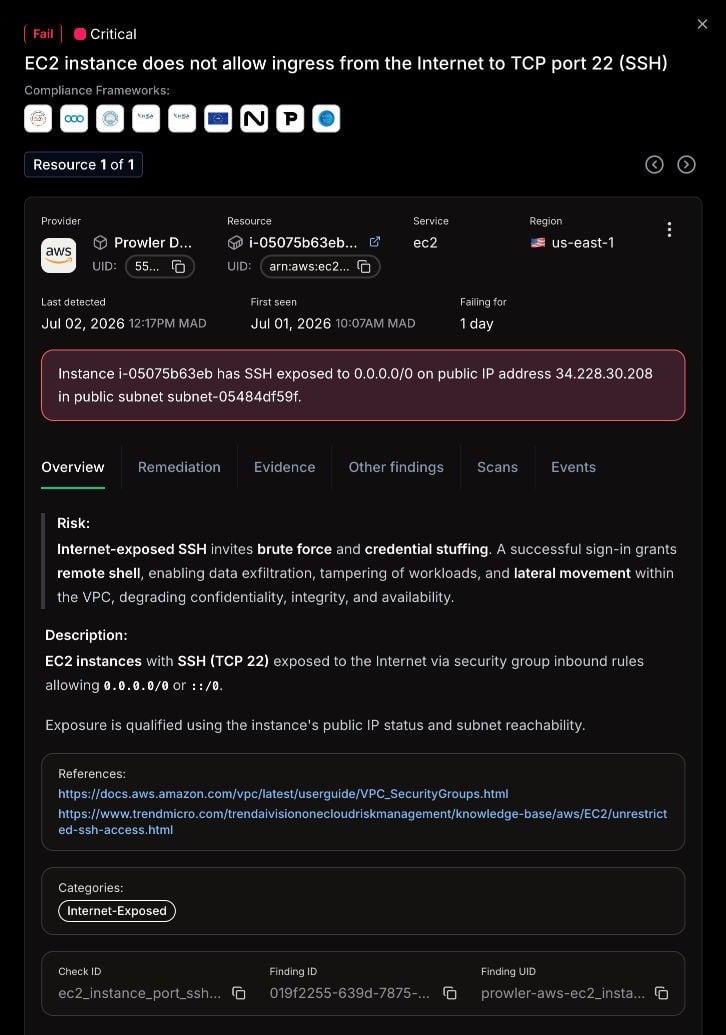
Viewing Finding Details
Click a finding node to open the finding detail drawer. The drawer uses the same finding detail layout as the Findings page and includes:- The finding title, status, and severity.
- The affected resource summary.
- Overview, remediation, evidence, related findings, scans, and events tabs when data is available.
- A Lighthouse AI action when the account has access to Lighthouse AI.
Fullscreen Mode
To expand the graph for detailed exploration, click the fullscreen icon in the graph toolbar. The fullscreen modal provides:- The graph in a full-size modal.
- The same zoom, fit, and export controls.
- The same node expansion, finding focus, hover highlight, and minimap interactions available in the standard view.
Available Queries
The query selector includes custom openCypher and built-in AWS queries for common security investigation workflows. Available queries are loaded from the selected scan and may change as new query packs are added. Available queries include:- Custom openCypher query: Write and run a read-only graph query.
- Exposure queries: Find internet-exposed EC2 instances, load balancers, open security groups, and resources by public IP.
- Inventory queries: List resources such as RDS instances.
- Misconfiguration queries: Find unencrypted RDS instances, public S3 buckets, and wildcard IAM statements.
- Privilege escalation queries: Detect IAM and AWS service paths based on known attack techniques, including queries based on pathfinding.cloud research by Datadog.
Using Attack Paths with the MCP Server and Lighthouse AI
Attack Paths capabilities are also available through the Prowler MCP Server, enabling interaction with Attack Paths data via AI assistants like Claude Desktop, Cursor, and other MCP clients. Prowler Lighthouse AI also supports Attack Paths queries, allowing you to analyze privilege escalation chains and security misconfigurations directly from the chat interface. The following MCP tools are available for Attack Paths:prowler_list_attack_paths_scans- List and filter Attack Paths scans.prowler_list_attack_paths_queries- Discover available queries for a completed scan.prowler_run_attack_paths_query- Execute a query and retrieve graph results with nodes and relationships.prowler_get_attack_paths_cartography_schema- Retrieve the Cartography graph schema for custom openCypher queries.
Example Questions
Ask through the MCP Server or Lighthouse AI:- “Find EC2 instances exposed to the internet with access to sensitive S3 buckets”
- “Are there any IAM roles that can escalate their own privileges?”
- “Show me all internet-facing resources with open security groups”
- “Which principals can create Lambda functions with privileged roles?”
- “List all RDS instances with storage encryption disabled”
- “Find S3 buckets that allow anonymous access”
- “Are there any CloudFormation stacks that could be hijacked for privilege escalation?”
- “Show me all roles that can be assumed for lateral movement”
- Asking an AI assistant to identify privilege escalation paths in a specific AWS account
- Automating attack path analysis across multiple scans
- Combining attack path data with findings and compliance information for comprehensive security reports